Research
Analysis tools for characterizing tissue surfaces of any shape
How are cells aligned on tissue surfaces? Does the alignment depend on local curvature? Where are regions of misalignment? Do these regions correlate spatially with the fluorescence signal of the molecular marker of interest? And how do all these properties change over time?
 These are challenging questions that are not easy to answer, as we typically capture two-dimensional
images of three-dimensional (3D) tissues. The main difficulty lies in accurately stitching together
individual images from a z-stack and reconstructing 3D information, regardless of the shape and structure
of the multicellular system. We took on this challenge and developed an image analysis pipeline that
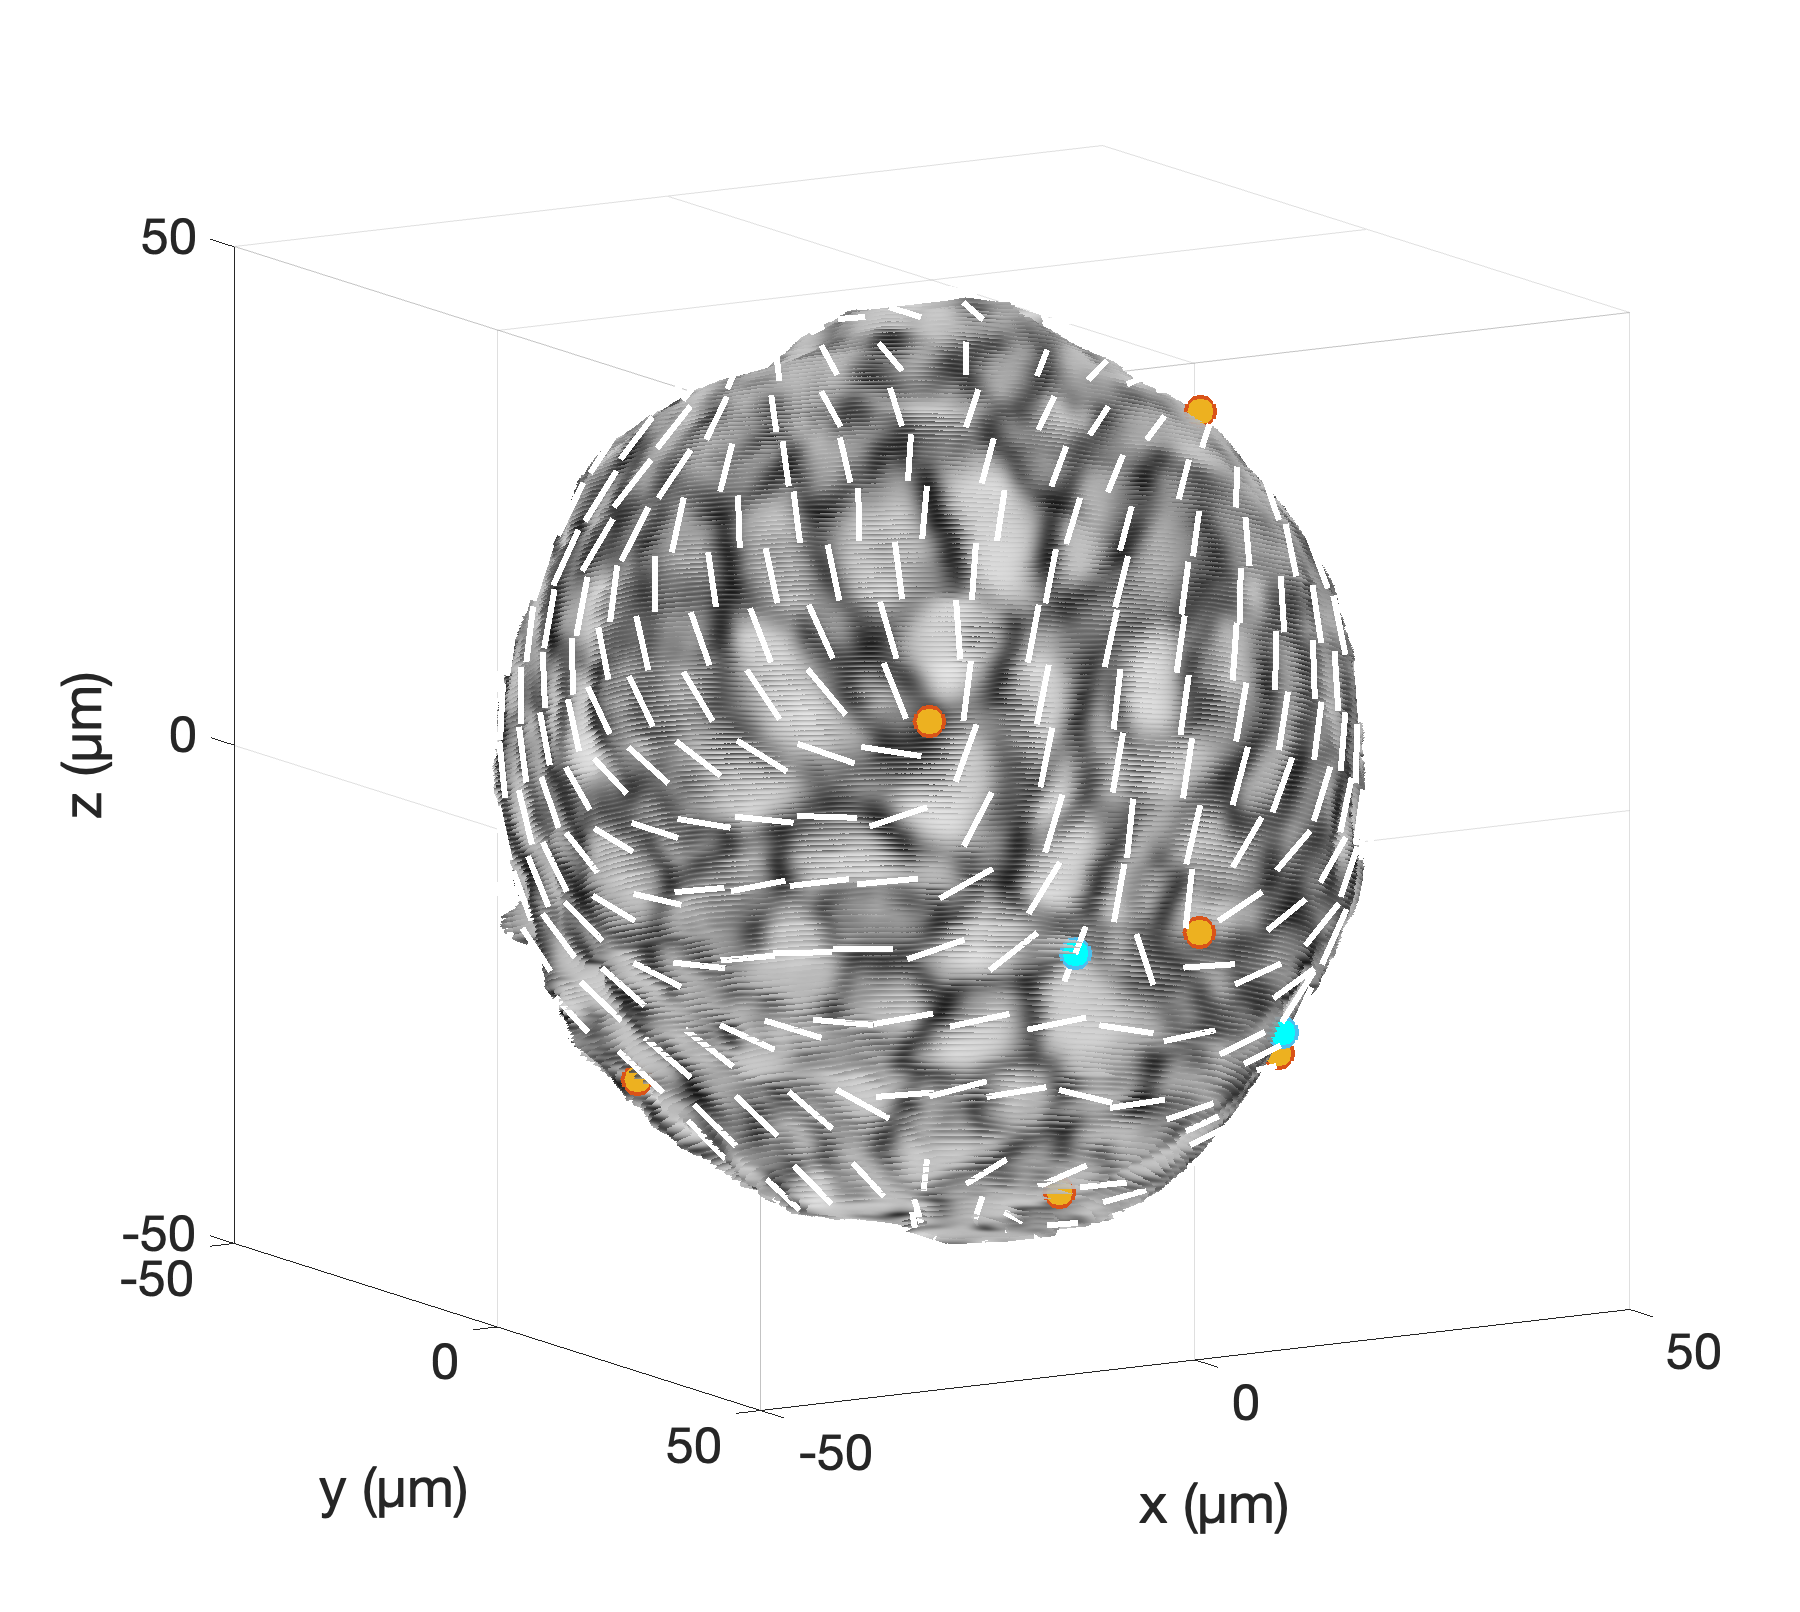
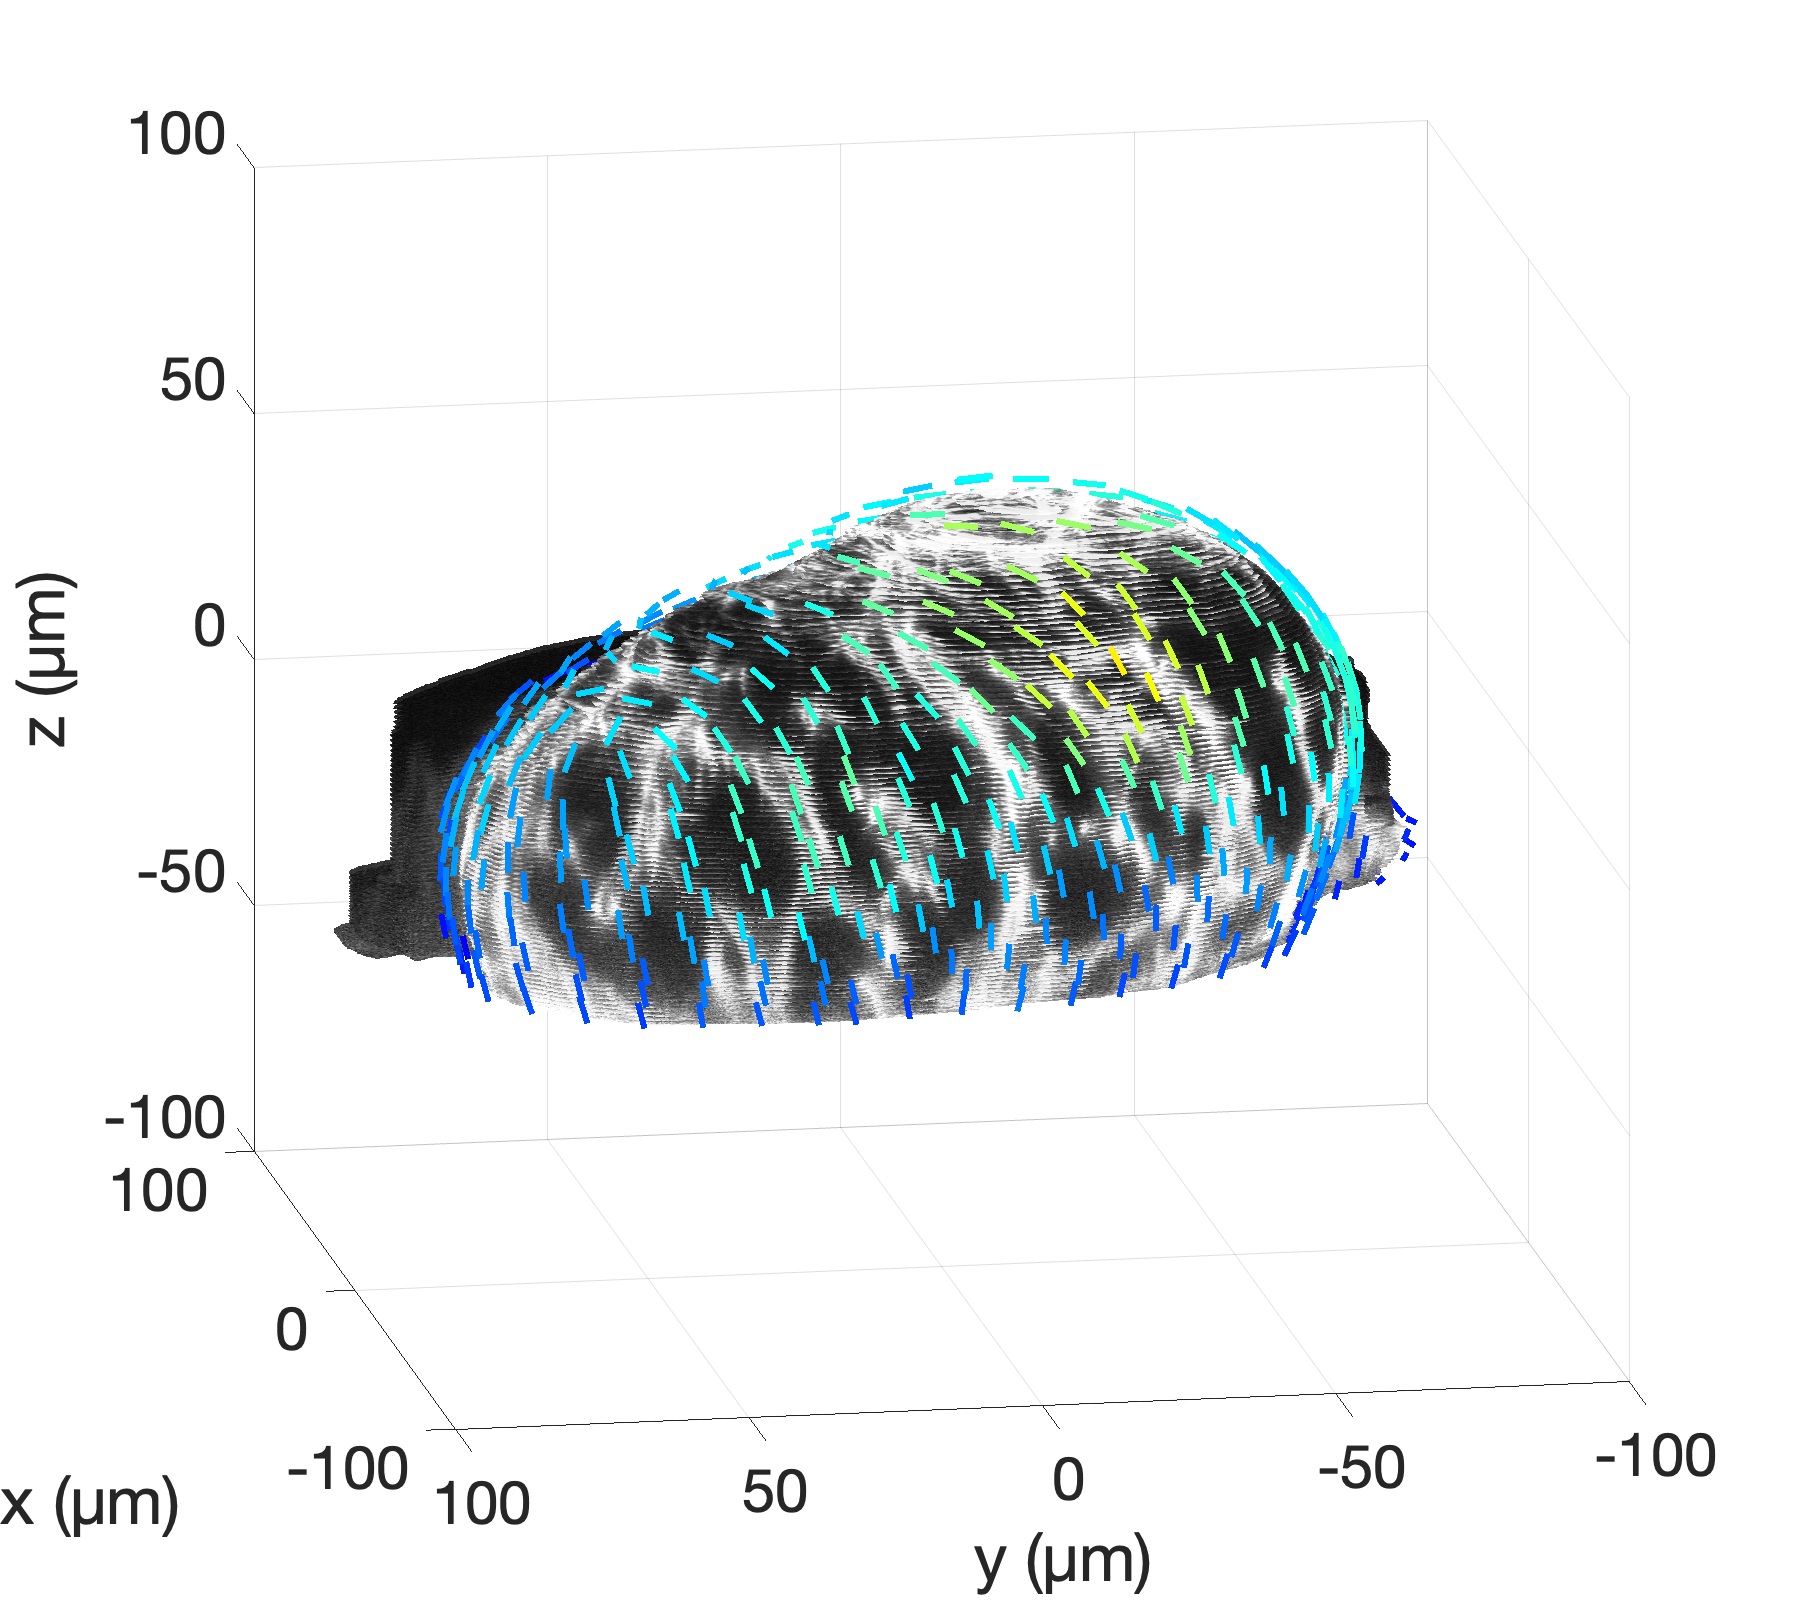
fully captures tissue properties such as nematic order, topological defects, local curvature,
and fluorescence signals from molecular markers across the entire surface of 3D tissues.
These are challenging questions that are not easy to answer, as we typically capture two-dimensional
images of three-dimensional (3D) tissues. The main difficulty lies in accurately stitching together
individual images from a z-stack and reconstructing 3D information, regardless of the shape and structure
of the multicellular system. We took on this challenge and developed an image analysis pipeline that
fully captures tissue properties such as nematic order, topological defects, local curvature,
and fluorescence signals from molecular markers across the entire surface of 3D tissues.
 By capturing these 3D properties, we can, e.g., verify theoretical predictions from simulations
by investigating the nematic orientation field of surface cells in multicellular aggregates. Additionally, this method allows us
to link biological mechanisms with physical descriptions in systems like the zebrafish heart. Our image analysis
tools now enable quantitative analysis of tissue surfaces and help us address the questions outlined above.
By capturing these 3D properties, we can, e.g., verify theoretical predictions from simulations
by investigating the nematic orientation field of surface cells in multicellular aggregates. Additionally, this method allows us
to link biological mechanisms with physical descriptions in systems like the zebrafish heart. Our image analysis
tools now enable quantitative analysis of tissue surfaces and help us address the questions outlined above.
➡ Eckert et al., Nat. Commun., 2025
➡ Analysis tools
Nematic and hexatic order in tissues
 Cytoskeleton filaments, bacteria, and various cell types often exhibit symmetries such as polar order
(symmetry under rotations by 360°) and nematic order (symmetry under rotations by 180°). The latter is one of
the most commonly used symmetries in describing tissues. Elongated cells can be modeled as rod-like objects that
align collectively, forming so-called liquid crystal phases—specifically nematic phases, which are characterized
by long-range orientational order without positional order.
Cytoskeleton filaments, bacteria, and various cell types often exhibit symmetries such as polar order
(symmetry under rotations by 360°) and nematic order (symmetry under rotations by 180°). The latter is one of
the most commonly used symmetries in describing tissues. Elongated cells can be modeled as rod-like objects that
align collectively, forming so-called liquid crystal phases—specifically nematic phases, which are characterized
by long-range orientational order without positional order.
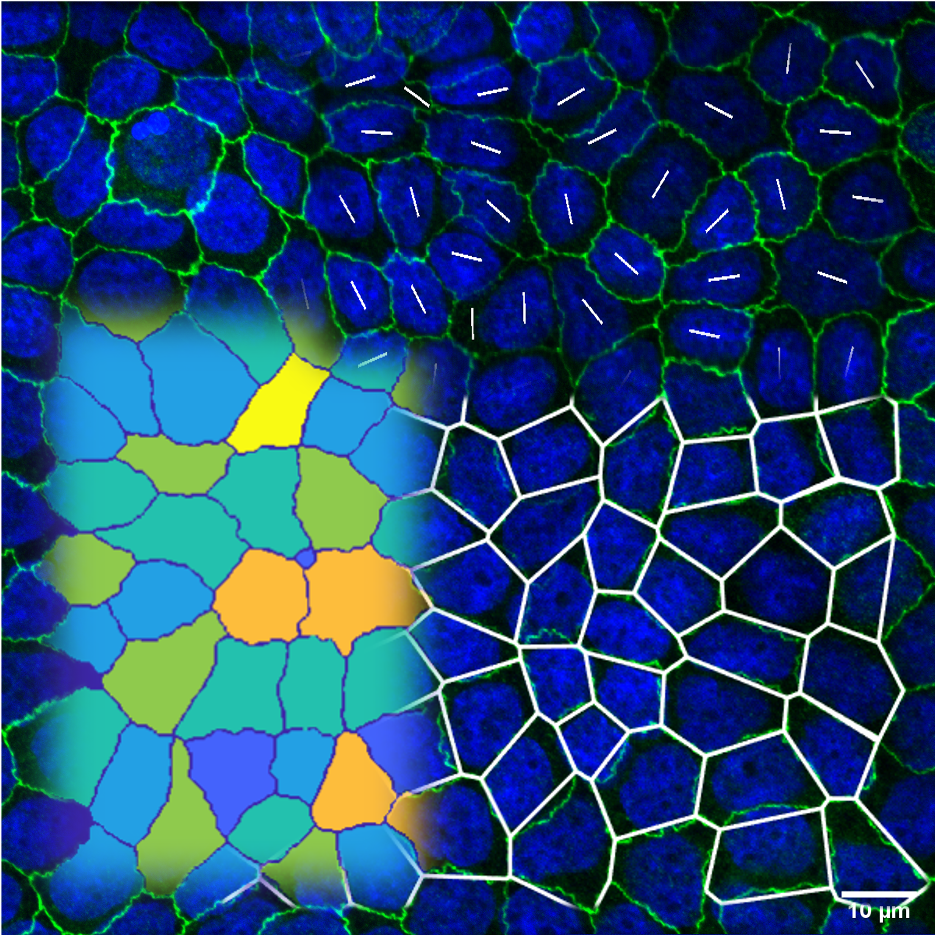
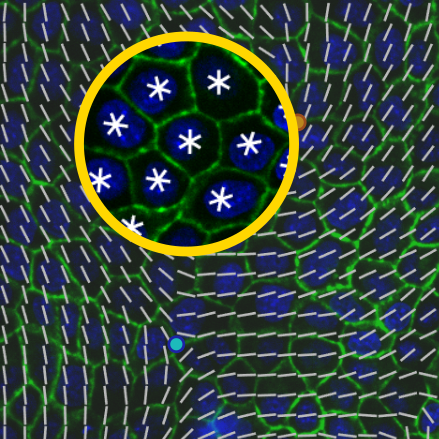
However, nematic order requires cells to be elongated. Are cells really elongated? Not always! In many tissues, such as epithelia, cells are organized in honeycomb-like lattices, where most cells are hexagonal, indicating hexatic order (symmetry under rotations by 60°). This raises an important question: Are tissues better described as nematic or hexatic?
 To address this, we combined in vitro experiments with numerical simulations to analyze the symmetry
of epithelial tissues. Unexpectedly, we discovered that epithelial tissues support multiple types of liquid
crystal orders that co-exist at different length scales: they are predominantly hexatic at small scales—e.g.,
individual cells or with their neighbors—and predominantly nematic at large scales—e.g., from the perspective
of the entire tissue [1]. We also found that the hexanematic crossover—the length scale at which the switch occurs—is
not fixed. It depends significantly on monolayer density, cell-cell adhesion, and underlying substrate
stiffness [2]. We identified this crossover length scale as a robust indicator of changes in mechanics and biochemistry
that influence tissue integrity. Therefore, exploring the crossover length scale between hexatic and nematic symmetry
provides a deeper understanding of cellular organization during development, homeostasis, and disease.
To address this, we combined in vitro experiments with numerical simulations to analyze the symmetry
of epithelial tissues. Unexpectedly, we discovered that epithelial tissues support multiple types of liquid
crystal orders that co-exist at different length scales: they are predominantly hexatic at small scales—e.g.,
individual cells or with their neighbors—and predominantly nematic at large scales—e.g., from the perspective
of the entire tissue [1]. We also found that the hexanematic crossover—the length scale at which the switch occurs—is
not fixed. It depends significantly on monolayer density, cell-cell adhesion, and underlying substrate
stiffness [2]. We identified this crossover length scale as a robust indicator of changes in mechanics and biochemistry
that influence tissue integrity. Therefore, exploring the crossover length scale between hexatic and nematic symmetry
provides a deeper understanding of cellular organization during development, homeostasis, and disease.
➡ [1] Armengol-Collado et al., Nat. Phys., 2023
➡ [2] Eckert et al., Nat. Commun., 2023
➡ Analysis tools
From traction forces to detachment forces
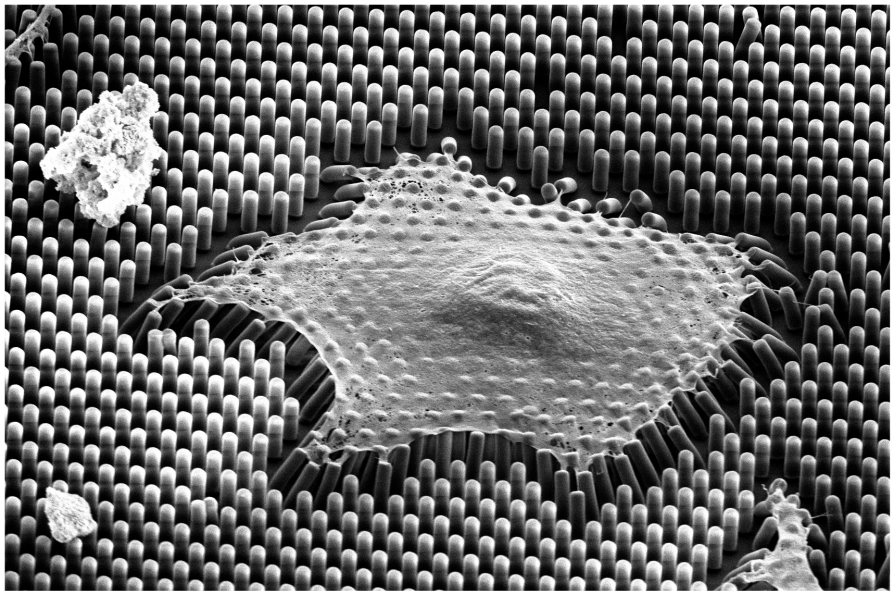 One method to measure cellular traction forces is using elastic micropillar arrays. These consist
of µm-sized beams on which cells can adhere at their tips and exert pulling forces through
intracellular contraction. This leads to the deflection of the pillars, providing the necessary
information to calculate traction forces. The local force resolution of the resulting force field
makes this method ideal for quantifying morphology-dependent force distributions within single
cells [1] and for investigating changes under external mechanical cues, such as hypergravity [2].
One method to measure cellular traction forces is using elastic micropillar arrays. These consist
of µm-sized beams on which cells can adhere at their tips and exert pulling forces through
intracellular contraction. This leads to the deflection of the pillars, providing the necessary
information to calculate traction forces. The local force resolution of the resulting force field
makes this method ideal for quantifying morphology-dependent force distributions within single
cells [1] and for investigating changes under external mechanical cues, such as hypergravity [2].
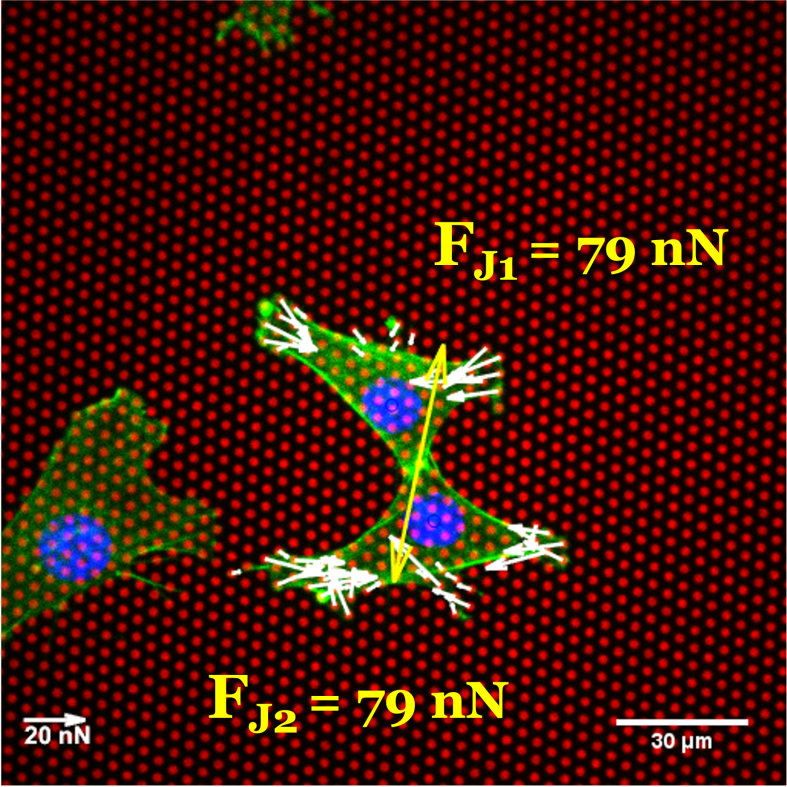 In a doublet configuration, micropillar arrays enable the measurement of forces acting at cell-cell
contacts, providing insight into how much of the total traction force is transmitted through these
contacts [3]. However, these measured intercellular forces are somewhat equilibrium-like and do not necessarily
reflect the maximum force that the contact can withstand. This raises the question: what is the maximum intercellular strength that
can hold cells together before the contact raptures?
In a doublet configuration, micropillar arrays enable the measurement of forces acting at cell-cell
contacts, providing insight into how much of the total traction force is transmitted through these
contacts [3]. However, these measured intercellular forces are somewhat equilibrium-like and do not necessarily
reflect the maximum force that the contact can withstand. This raises the question: what is the maximum intercellular strength that
can hold cells together before the contact raptures?
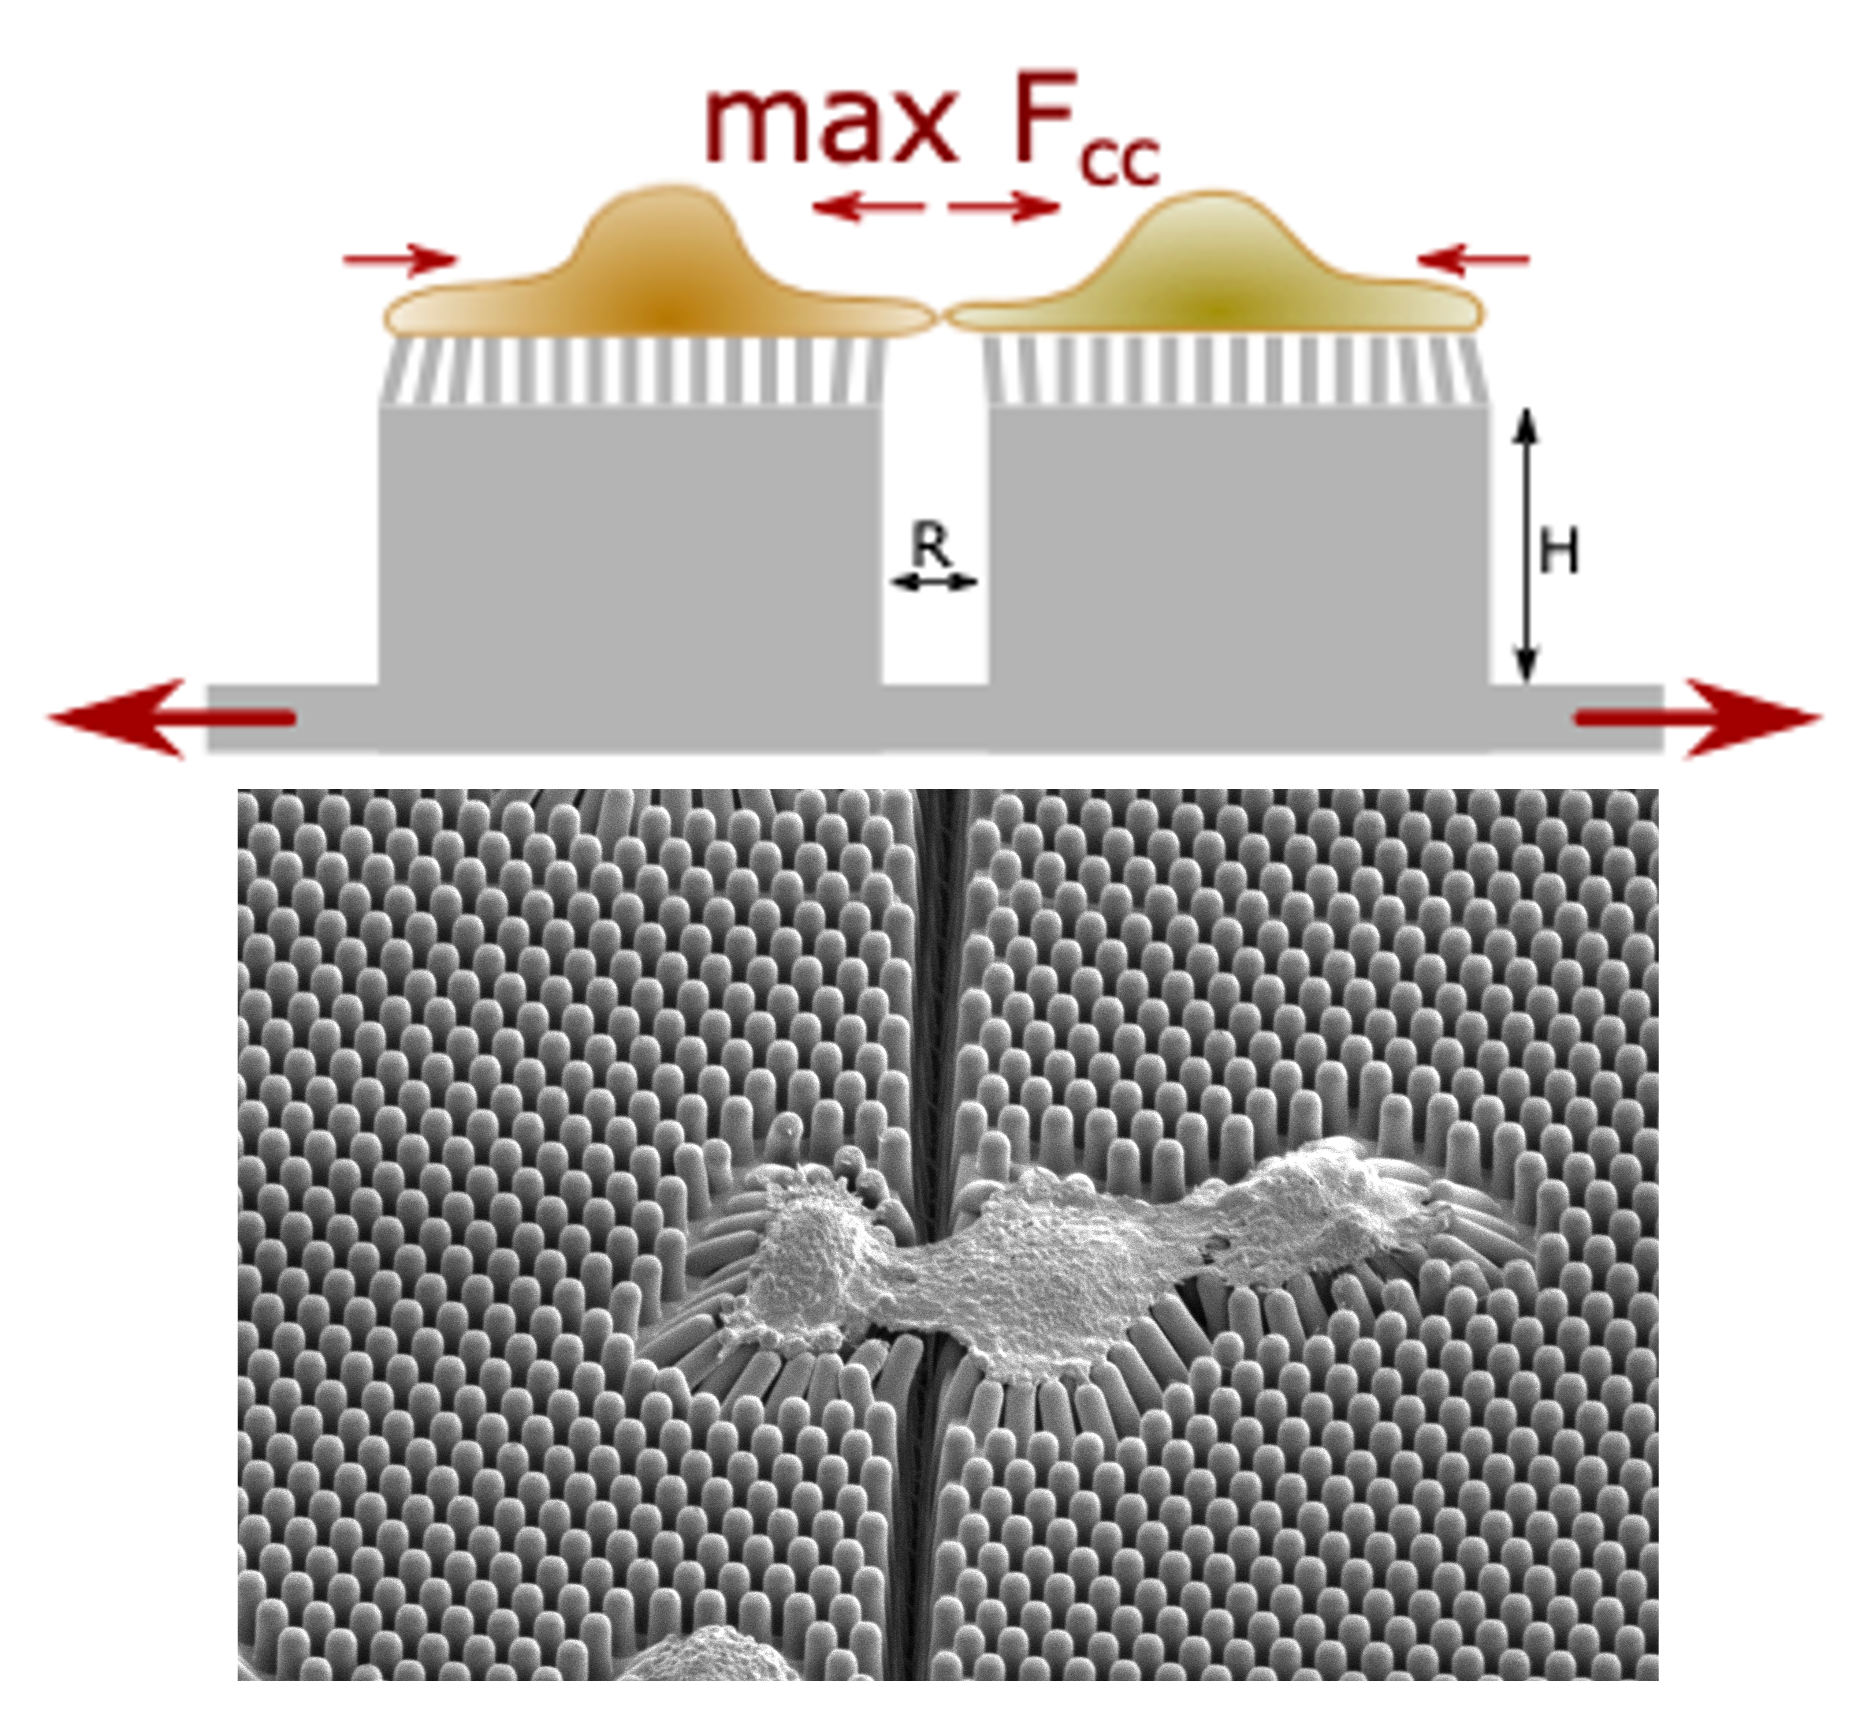 Building on the elastic micropillar array assay, we designed the Cell-Cell Separation Device (CC-SD)
to measure detachment forces between spread cells [3]. The CC-SD consists of pillar arrays connected
to blocks to which cells can adhere and connect across the gap between the blocks. By applying a
controlled stretch to separate the blocks, the strain at the cell-cell contact increases until it eventually
breaks. Since the pillars' position remain largely unaffected by the substrate stretch, they are
used to determine the intercellular adhesion force. Our design allows for a block separation of up
to 2.4-fold, which is sufficient to break cell-cell contacts, thereby enabling the forces that resist tissue rupture
to be investigated.
Building on the elastic micropillar array assay, we designed the Cell-Cell Separation Device (CC-SD)
to measure detachment forces between spread cells [3]. The CC-SD consists of pillar arrays connected
to blocks to which cells can adhere and connect across the gap between the blocks. By applying a
controlled stretch to separate the blocks, the strain at the cell-cell contact increases until it eventually
breaks. Since the pillars' position remain largely unaffected by the substrate stretch, they are
used to determine the intercellular adhesion force. Our design allows for a block separation of up
to 2.4-fold, which is sufficient to break cell-cell contacts, thereby enabling the forces that resist tissue rupture
to be investigated.
➡ [1] Eckert et al., Micro, 2021
➡ [2] Eckert et al., Biophys. J., 2021
➡ [3] Eckert et al., Rev. Sci. Instrum., 2025